
Make business decisions based on key metrics.
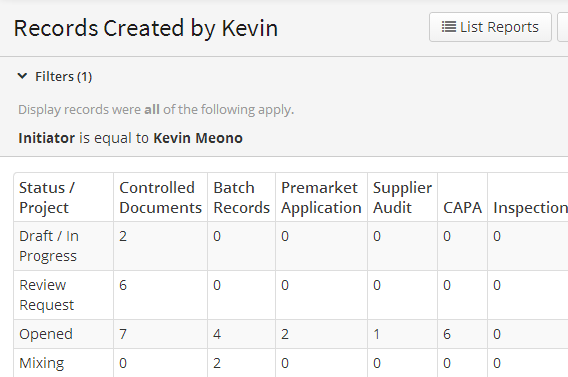
Ad Hoc Reporting
Configure your reports to fit your business needs.
ACE Analytics™ provides a platform to allow you to share beautiful print-ready and interactive reports and dashboards with as many users as you want. Reports can be used to organize, analyse, and share any data related to your records being tracked within ACE Analytics™. Whether you are a manager who wants to drill down to view more details in an interactive report or an analyst who needs to explore and visualize data ACE Analytics has you covered.
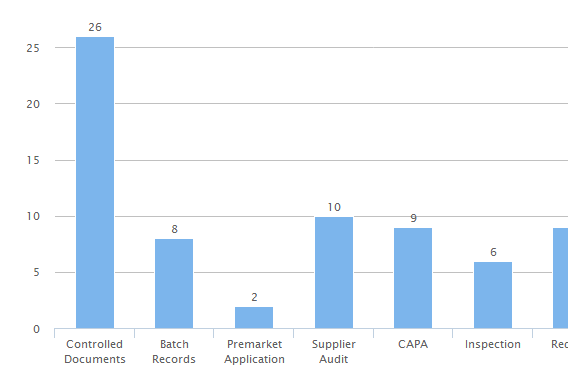
Data Visualization
See it. Understand it.
With compelling visuals, you can gain and share insights into your data. Explore all your data and discover trends, spot correlations, forecast future outcomes and find new opportunities. With powerful analytics that anyone can use, users of all skill levels can conduct fast, thorough explorations of ACE Analytics™ data.
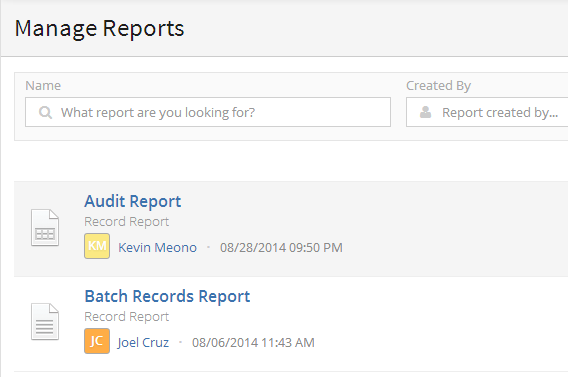
Collaboration
Alignment for better business decisions.
Share visual insights with others using ACE Analytics™, or easily export data into documents everyone can use. ACE Analytics™ allows the export of data to a familiar Microsoft Office environment, including Word and Excel, to easily share information with others.